Digitally checked; not yet worked as a physical swatch. Make a test piece before starting a full project.
FROM AN IMAGE TO A COLORWORK PLAN
Create a Tapestry Crochet Chart from a Photo
A rectangular stitch chart. A color key you can follow.
ORIGINAL ARTWORK
GAUGE-AWARE CHART
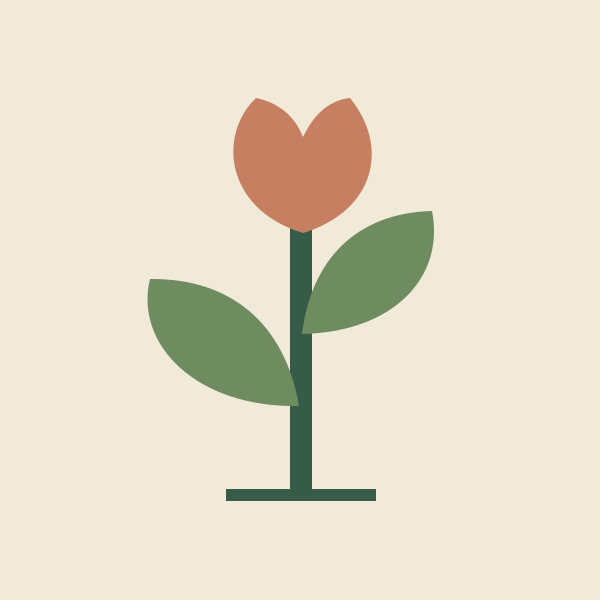
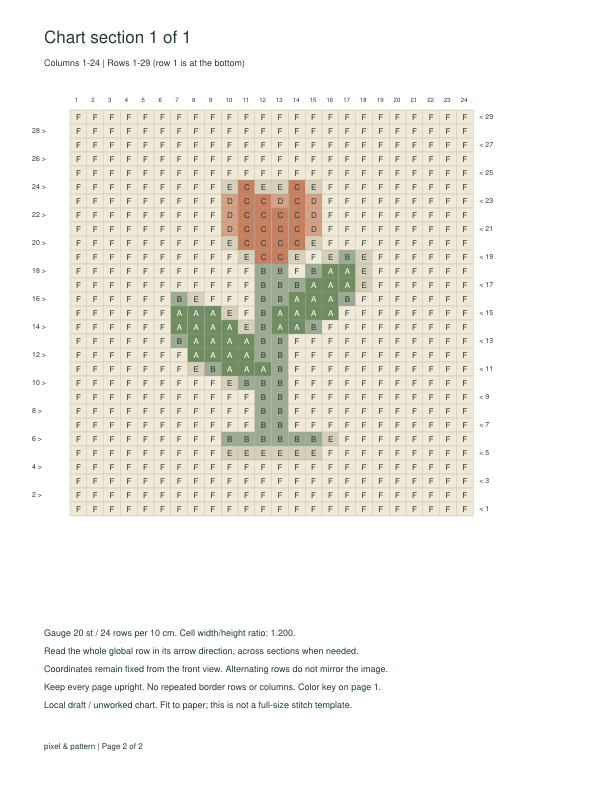
Sprig · 24 stitches × 29 rows · 6-color limit Example gauge: 20 stitches / 24 rows per 10 cm. Digital output, not a photograph of crochet.
A crochet tapestry pattern maker for flat charts
Choose a clear photo or illustration, set the stitch count, and simplify its colors. This tapestry crochet pattern generator creates a color chart for flat, turned rows of US single crochet (UK double crochet). Each cell represents one stitch; letters identify colors.
Try our original Sprig artwork to see how the source becomes a chart. For your own photo, crop around a strong subject first. Fine lettering, faces, and small details may need more stitches than a simple silhouette.
A real tool export. Downloading the example leaves your current image and edits in place.
YOUR SWATCH SETS THE PROPORTIONS
Match the Graph to Your Stitch Gauge
Stitches have a width. Rows have a height.
Measure both directions
Make a swatch using your intended yarn, hook, and stitch technique. Count stitches horizontally and rows vertically over the same measured span, then enter those numbers. The defaults demonstrate the calculation; they are not a universal gauge.
With proportions locked, the tool chooses a row count that keeps the subject’s approximate shape after allowing for your stitch width and row height. Counts round to whole stitches and stay within 8–128. Unlock the dimensions to choose both counts; Fit entire image then adds background space where needed, while Center crop fills the chart.
For example, a square image at 20 stitches and 24 rows per 10 cm needs about 29 rows for 24 stitches across. Its calculated area is 12 × 12.1 cm. Tension, blocking, and carried yarn can change the real result.
Cell width ÷ height = row gauge ÷ stitch gauge. The preview and PDF use this ratio.
KEEP THE SHAPE. REVIEW THE SMALL DETAILS.
Reduce Colors and Isolated Stitches
Fewer colors to manage. Every cleanup can be undone.
BEFORE · ONE ISOLATED STITCH
AFTER · NEIGHBOR COLOR
Controlled digital example produced by the cleanup function. No physical stitch test is implied.
Simplify one pass at a time
Start with the color limit. A small palette reduces the number of yarn colors represented in the chart, but it does not guarantee an easy project. Screen colors are visual references, not matched yarn products.
Clean isolated stitches looks for a cell with no matching neighbor directly above, below, left, or right. It replaces that cell only when at least two of those neighbors share another color. All decisions in a pass use the same starting chart, so the result does not depend on updates made earlier in the pass.
Small accents may be intentional. Inspect the result, use Undo or Redo, and repeat only if useful. The last 20 cleanup actions are available. Choosing another image or changing conversion or gauge settings starts a new cleanup history; changing row direction keeps your edits.
Row 1 is at the bottom. With the right-edge setting, odd rows read right to left and even rows left to right; the left-edge setting reverses that order. The picture stays in a fixed front view. Changing the reading direction does not mirror it.
The PDF starts with a symbol and color key, followed by chart sections. Larger charts split left to right in horizontal bands, beginning at the bottom band. Follow a complete global row across sections in its arrow direction before moving to the next row. No border stitches are duplicated between pages.
Print on Letter or A4 using Fit. The cell proportions reflect the entered gauge, but the printed squares are not actual stitch sizes. Symbols-only mode omits the color fills. Counts in the key are chart stitches, not yarn length or skein requirements.
The output contains a graphic chart only. Written row instructions, foundation-chain counts, turning-chain instructions, and garment shaping are not generated.
A CLEAR SCOPE FOR YOUR NEXT PROJECT
What This Graph Maker Supports
Colorwork planning for one technique. Check a small swatch before scaling up.
Included in this chart
Flat tapestry colorwork using US single crochet, a measured gauge, a rectangular grid, color reduction, isolated-stitch cleanup, and numbered PDF charts with alternating row directions. Transparent source areas are filled with the selected background color; every chart position is a stitch.
Outside this version
C2C, mosaic, filet blocks, rounds, increases/decreases, complete garment patterns, yarn quantities, and written row instructions. Stitch slant and yarn behavior are not simulated. The supported gauge ratio is 0.5–2 rows per stitch; this range is a tool limit, not a crochet rule.
Links carry your source and settings within this tab. PNG/XLSX preserve the current chart colors when opened, but do not carry crochet gauge or row-direction formatting.
Before you start stitching
Can I turn a picture into a tapestry crochet graph?
Yes. Use PNG, JPG, or WebP up to 20 MB and 24 megapixels. Choose your stitch count and measured gauge, then inspect the outline and color changes. The result is a chart for the stated single-crochet technique, not a complete project recipe.
How does stitch gauge change the shape of my chart?
Gauge determines the width and height represented by a cell. With the proportion lock on, changing the stitch-to-row ratio recalculates the other chart dimension. With the lock off, your counts stay fixed and the picture is fitted or cropped into the gauge-aware area. Whole-stitch rounding and the 8–128 limits can affect the final proportions.
Does the tool generate written row instructions?
No. It exports a numbered color chart with symbols and row directions. Written stitch-by-stitch instructions, chain setup, shaping, and yarn estimates are outside this version.
Can I start the chart from the left side?
Yes. Set Row 1 starts to At the left edge. Row 1 reads left to right, row 2 right to left, and directions continue alternating. This controls chart reading only; it does not mirror the source image or teach a different stitch technique.
How do I remove single-color specks without losing detail?
Try one cleanup pass and compare the result. A tiny eye or highlight can qualify as isolated, so the tool cannot decide whether that detail is important. Use Undo if the change removes something you need. Changing conversion settings resets cleanup history.
Will transparent pixels become holes in the crochet?
No. This is a filled rectangular single-crochet chart. Transparent areas are composited onto your selected background color and counted as stitches. It does not produce filet openings or shaped edges.
Are the example charts physically tested?
Not yet. The digital checks cover gauge calculations, color counts, reading directions, cleanup, and PDF boundaries. They do not establish how a specific yarn or stitch tension will behave.
Is my photo uploaded or saved?
Conversion and export run locally in your browser. No image or filename is sent to our server. Switching tools in this tab temporarily stores the source and settings in the browser. A transfer is deleted when read; unused transfers expire after one hour and are cleaned up at the next transfer. Download your chart before closing the tab.